As a Calgary home owner (or prospective home owner), it is understandable you want to know the value of Calgary homes and keep up with the real estate trends in your community.
We offer a variety of free resources to help you understand the Calgary real estate market.
Market reports
Our free monthly market reports show the sold prices of homes (including images and addresses) with cool graphics for a quick overview.
Monthly real estate stats
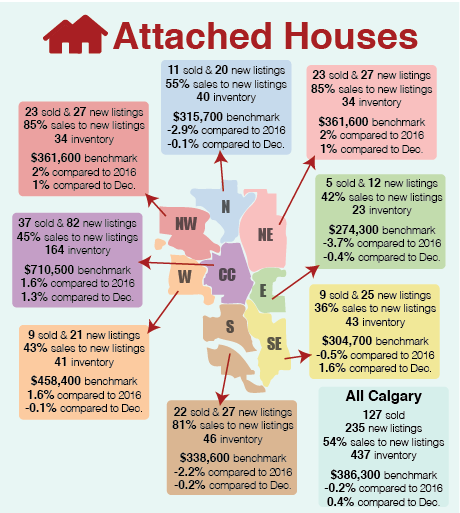
Every month, we publish a monthly report of Calgary real estate stats that are issued by the Calgary Real Estate Board. We also add a simple infographic to get you to the nitty-gritty details even faster.
Live statistics
The Calgary Real Estate Board offers an extensive package of statistics, including live Calgary real estate statistics.
Real estate statistics explained: about pricing
To complement all the statistics, graphics, numbers and reports, we created a summary and explanation of the terms used within the Calgary real estate statistics:
- Average price: The total dollar amount of all sold properties divided by the total number of properties sold. Looking at the average price of a Calgary community where only a few homes get sold can be risky. Just the one sale of that one million-dollar home down the street can increase the average price a lot, giving the home owner a skewed idea about the trends in the community. A good example are the communities with R-C2 zoned lots where infills are being built, such as Killarney and Altadore. The bungalow moves out, and $2 million infills move in. Therefor benchmark pricing may be a better indicator to use if your community has a big variety of home-styles.
The benchmark price is the price of a typical home in an area or community
- Benchmark price: The short explanation is that the benchmark price is the price of a typical home in an area or community. With ‘typical’ the Calgary Real Estate Board means the most common home style in a community. For example: apartments in the Beltline and bungalows in Brentwood. Think of typical indicators (attributes) such as home style, number of bedrooms, square footage etc. If you want to see what attributes are being used by the CREB, read the Benchmark Attribute Report. It is only 800 pages. Any high-end properties or any low-end homes will not be included in benchmark price. So, looking at benchmark pricing can give a more stable overview, if you live in a community where the sales is limited, but the average price could be jacked up because that $1 million home sold.
- Median price: This price shows the exact middle of all the homes sold. If 13 homes sold in a community, the sold prices will be sorted from low to high. The price of the 7th home gives the median price. Exactly half (6) the homes are sold below and half (6) are sold above.
- MLS® Home Price Index (HPI): The time of index is January 2005. The new index is published every month, nation wide. It is calculated, based on a set of quantitative features such as number of bedrooms, bathrooms, size, age, but also on qualitative features such as views, proximity to schools and shopping.
Inventory and new listings are very important factors in real estate
- Inventory: The total number of properties currently for sale on the MLS.
- Months of supply: The total number of properties in inventory divided by the total number of monthly sales. If there are currently 80 homes for sale (inventory), but only 5 homes sold that month, the months of supply is 16. It would take 16 months to sell all 80 homes. This number is often used to indicate if it is a buyer’s market or a seller’s market in Calgary.
- New listings: The number of properties that were listed on the MLS.
- Sales-to-new listings ratio: The total number of sales in a period of time, divided by the total number of new listings for that same period of time. If 35 homes sell in one month, and 12 new homes are listed in that same month, the sales-to-new-listings ratio is 2.9.
- Sales price to list price ratio: The sales price divided by the list price of the property sold. If a home is listed for $525,000 and sells for $498,000, the sales to list price ratio is 95%. This number can also be calculated as an average if you take a number of homes, of a particular community for example. So average sale price divided by the average sold price of properties.
- DOM: Days on the market. The number of days that a property was on the market, before it got sold. This number can also be calculated as an average if you take, for example, a community of homes. It is just an average indicator that you should read month over month. It does not necessarily indicate how fast your home sells, as many factors indicate how fast a property sells. Obviously pricing your home right is the main factor.
Month over month, year over year…
- M/M%: Change of percentage looking month-over-month. For example February compared to January.
- Q/Q%: Quarter-over-quarter percentage of change. Basically looking per season.
- Y/Y%: Percentage of change, compared year-over-year, so 2018 is being compared with 2018.
- YTD: Means year-to-date. The count starts at January 1 of a year.
And as a last note: Homes that were sold, directly via a builder, are not included in the data. New homes are only included in all these data, if that home was listed on the MLS.